Make stronger decisions with new Google Play Console data
Posted by Tom Grinsted, Product Manager, Google Play
At this year’s Google I/O, we announced a slate of new features to help you take your business further with Google Play. Launching today, these changes include several improvements designed to help you make better decisions about your business by providing clearer, more actionable data.
We know the right data is critical to help you improve your app performance and grow your business. That’s why we’re excited to share a major update that enables you to better measure and analyse your core statistics — the most fundamental install and uninstall metrics by user and device. We’ve also enhanced the Statistics page on the Play Console to show change over time, enable more granular configurations, and, coming soon, exclusive benchmarks for core stats!

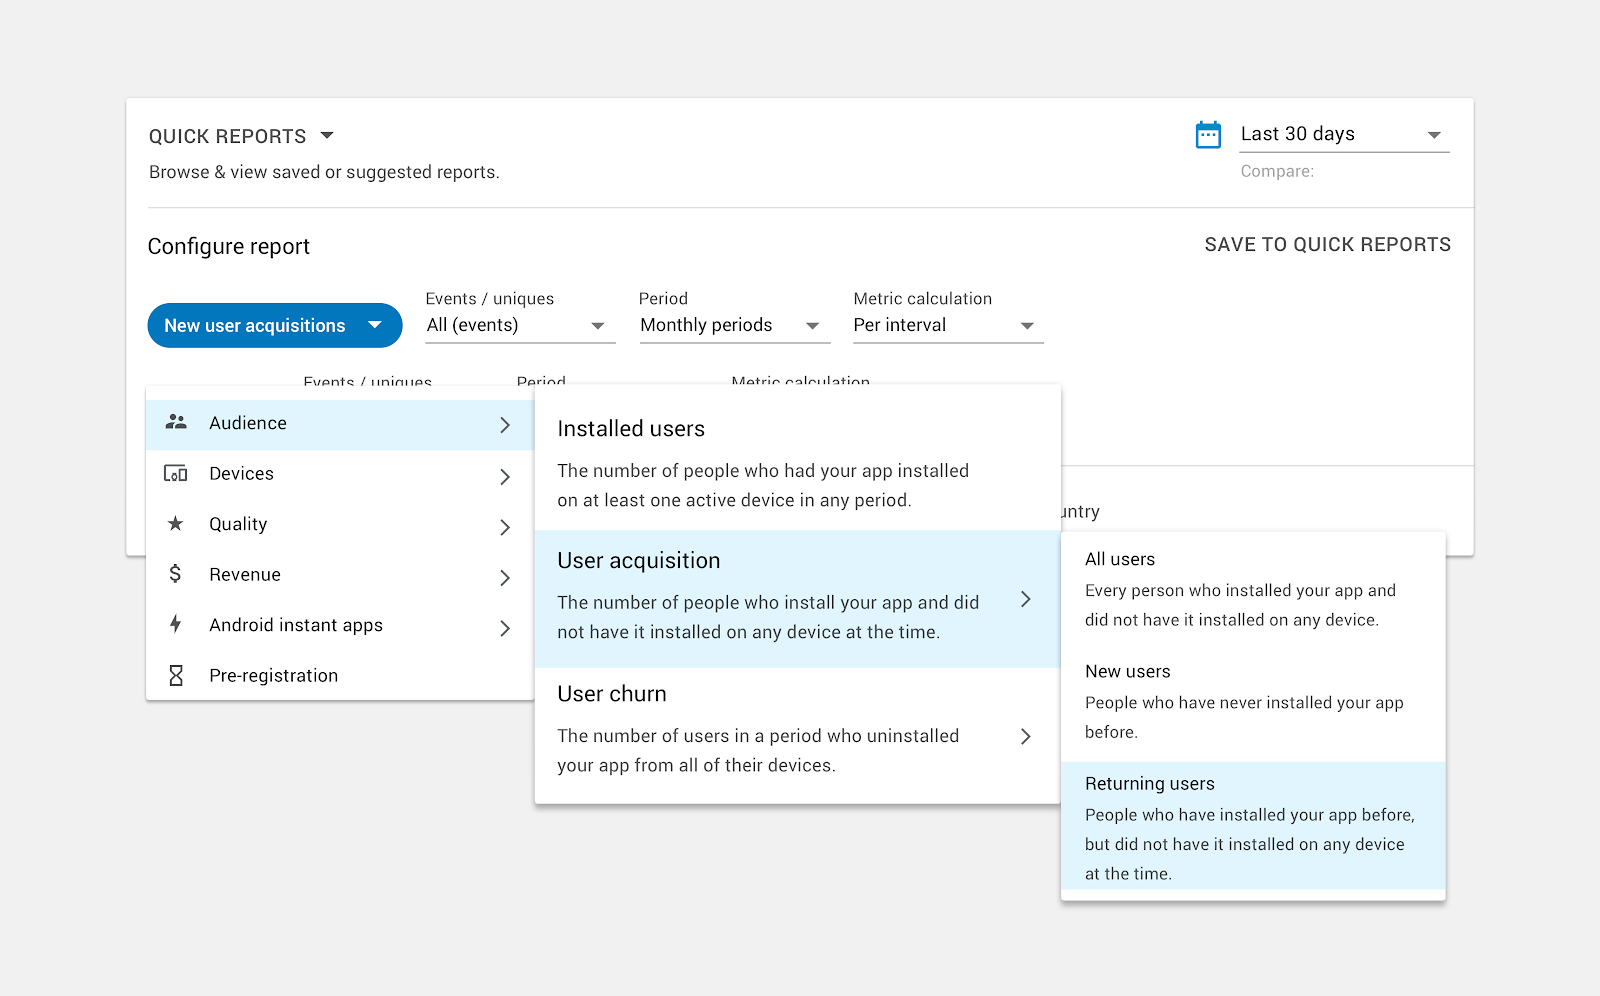
More granular configurations are now available on the Statistics page
to help you better understand your acquisition and churn.
More accurate and more expansive than before, the new metrics will help you better understand your acquisition and churn. For the first time, we are including data on returning users and devices - something that we understand is critical to many developers' growth strategies.
We’re also including new install methods (such as pre-installs and peer-to-peer sharing) and the ability to aggregate and dedupe over periods that suit your business needs. With these new updates, you can perform analyses that weren’t possible before, such as how many people re-installed your app last month.
Here’s what else is new:
- Clearer, consistent metrics definitions:
- Select users or devices, acquisitions or losses
- Define if you’re interested in new, returning, or all users
- Measure events (for example, when someone installs) or uniques (for instance, every person who installs)
- Select users or devices, acquisitions or losses
- Change analysis charts automatically show the largest changes during a selected period of time for a given dimension, making it easy to see the largest contributors to your metric trends.
- Saved reports allow you to configure your metrics just the way you want them, then save them for easy retrieval and common analyses.
- Suggested reports help you to find interesting ways to combine your data for more valuable analysis.
- And finally, all configured data can be downloaded as CSVs from within the interface.
As a result of these updates, you will notice a few changes to your metrics. Old metrics names will be deprecated, but you can configure new metrics that map to the old ones with this cheat sheet. And don’t forget to use the ‘save report’ feature on the stats page so you can easily return to any configurations you find particularly helpful!
Don’t forget to use the ‘save this report’ feature on the stats page to easily return to any configurations you find particularly helpful.
Other metrics like active user and active device will see a step-change as the new definitions are more expansive and include previously under-counted data.
Some new metrics map onto older ones. Where this happens, all historic data will be automatically included. But in other cases new metrics will only be generated from launch day. For unique devices or users, weekly metrics will start to appear two weeks after launch, monthly metrics once there’s a single full month’s data, and quarterly metrics once there’s a full quarter’s data.
We know it’s a lot to take in at once, so make sure to bookmark the cheat sheet for helpful tips as you navigate the transition and explore your new metrics. Additionally, our Decision-Making with the Google Play Console session from Google I/O and our Play Academy training are other great resources to help you get up to speed.
Check out these updates in the Google Play Console today — we hope you find them useful. Your comments help to shape the future of Google Play, so please continue to let us know what you think.
How useful did you find this blog post?


Komentar
Posting Komentar